Project Type
Uber-Sponsored Capstone Project
Team
3 Product Designers (including me), 1 Software Engineer
TOOLS
Figma, Claude Code, Cursor, Vercel
Timeline
6 months (Jan–Jun 2026)
Overview
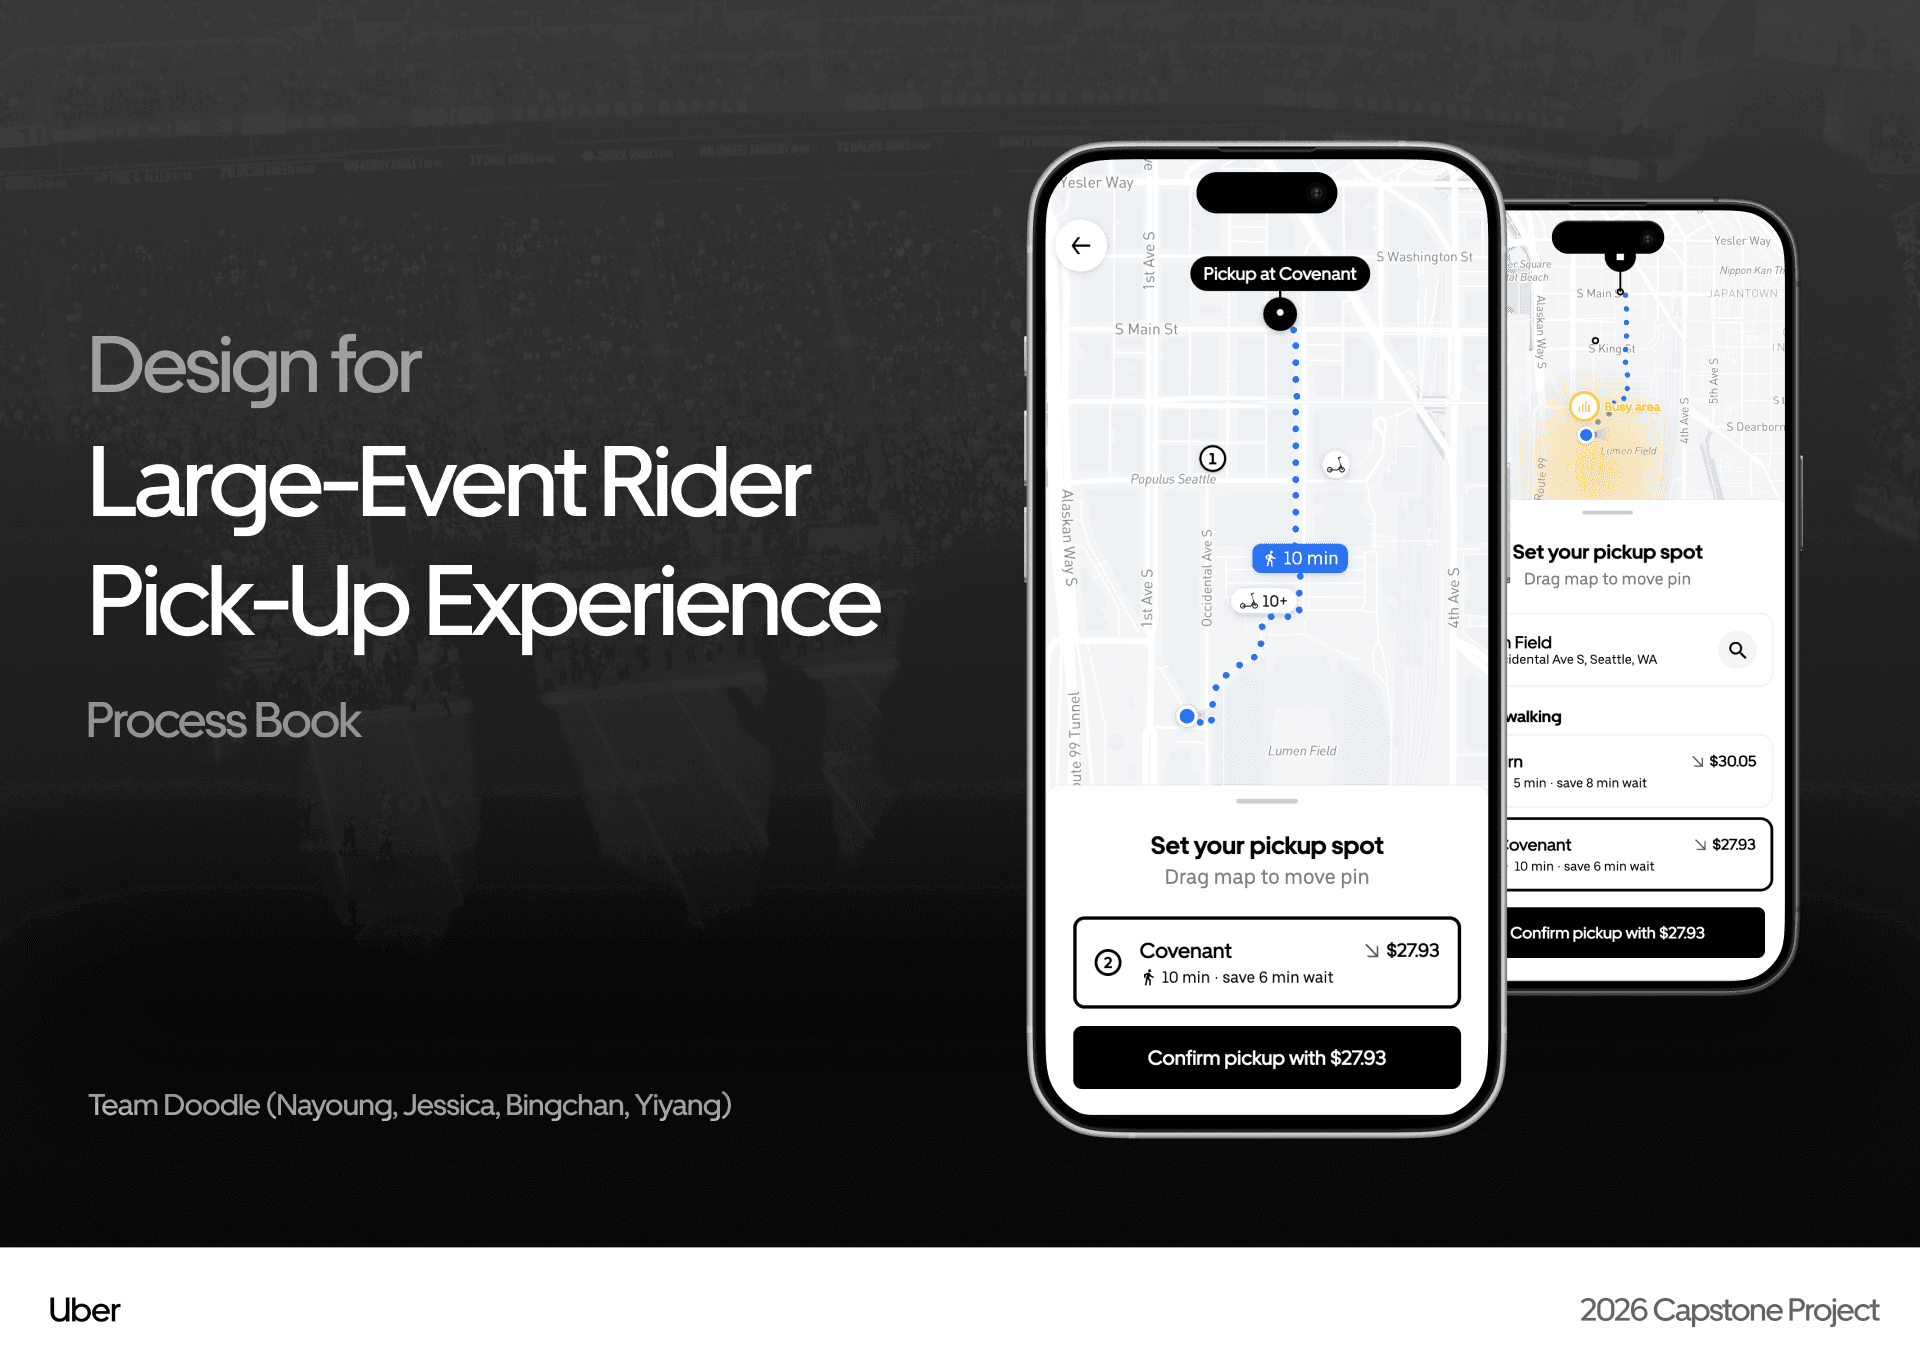
As the FIFA World Cup 2026 approaches, Uber is preparing for a surge in large-event pickups. We redesigned the rider experience to help people support confident pickup decisions, reduce uncertainty throughout the pickup journey, and improve pickup coordination.
What I did
Led end-to-end user research and synthesis
Designed the primary rider experience and key user flows
Built and deployed the interactive prototype with Cursor and Vercel
Served as the primary contact between the team and Uber stakeholders
my Impact
Testing showed greater rider confidence and faster decision-making under crowded pickup conditions
39%
43%
Final Design highlights
Choosing a ride
Supporting informed pickup decisions before requesting a ride
Compare recommended pickup locations using walking time, wait time, and price trade-offs.

Waiting for a match
Making waiting feel more predictable
Stay informed while optional rewards help make longer waits more worthwhile.
Finding the driver
Guiding riders to the right driver
Real-time orientation cues and directional guidance help riders locate driver faster.
The context
As the FIFA World Cup approaches, Uber is preparing for a surge in large-event pickups.
Improving this experience has the potential to positively impact hundreds of thousands of riders.
690K+
Potential riders supported during Seattle FIFA events
16
Host cities across North America

The Problem
Large-event pickups lead to failed matches and longer waits.
After leaving an event, riders must quickly find a pickup spot while navigating crowded streets, road closures, and constantly changing conditions.

Why it matters?
Rider
Makes decisions with limited guidance, leading to uncertainty and longer waits.
Driver
Spends more time locating riders instead of completing trips.
Business
Lower pickup success reduces ride completion and marketplace efficiency.
RESEARCH
To understand what was causing failed pickups, we conducted:


03
Interviews
11 rider interviews to uncover behaviors and pain points.


KEY RESEARCH insights
The highest-risk moments, where riders lacked guidance, became our design focus.
Across the pickup journey, riders repeatedly created their own strategies whenever the app didn't provide enough guidance. These behaviors revealed the moments where uncertainty was highest and riders were most likely to abandon or retry the pickup process.

We reframe the challenge
How might we reduce uncertainty throughout the pickup journey to help riders make confident decisions?
These insights shaped three design principles that guided our design decisions while aligning with Uber's existing design guidelines.
(This case study focuses on the highest-priority opportunity: helping riders confidently choose a pickup location.)
01
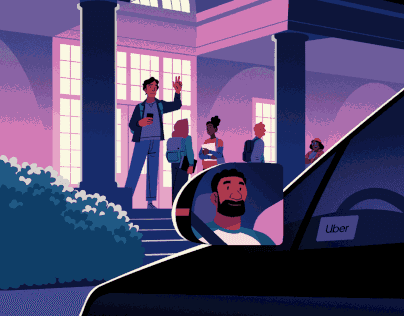
Balance transparency with comfort
02
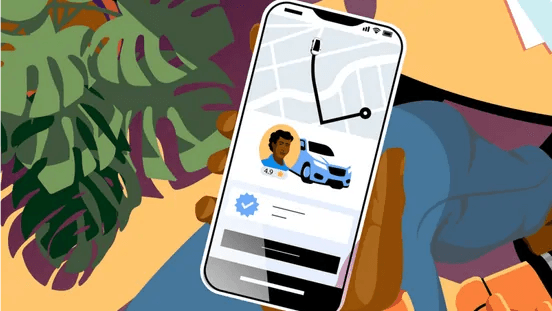
Preserve map clarity and readability
Add guidance without compromising the map's readability.

03
Support confident trade-off decisions
Help riders compare walking time, wait time, and price without cognitive overload.
Design Goal
Increase successful pickups by helping riders confidently choose a pickup location.

Ride cancellations before pickup

Pickup completion rate

insight
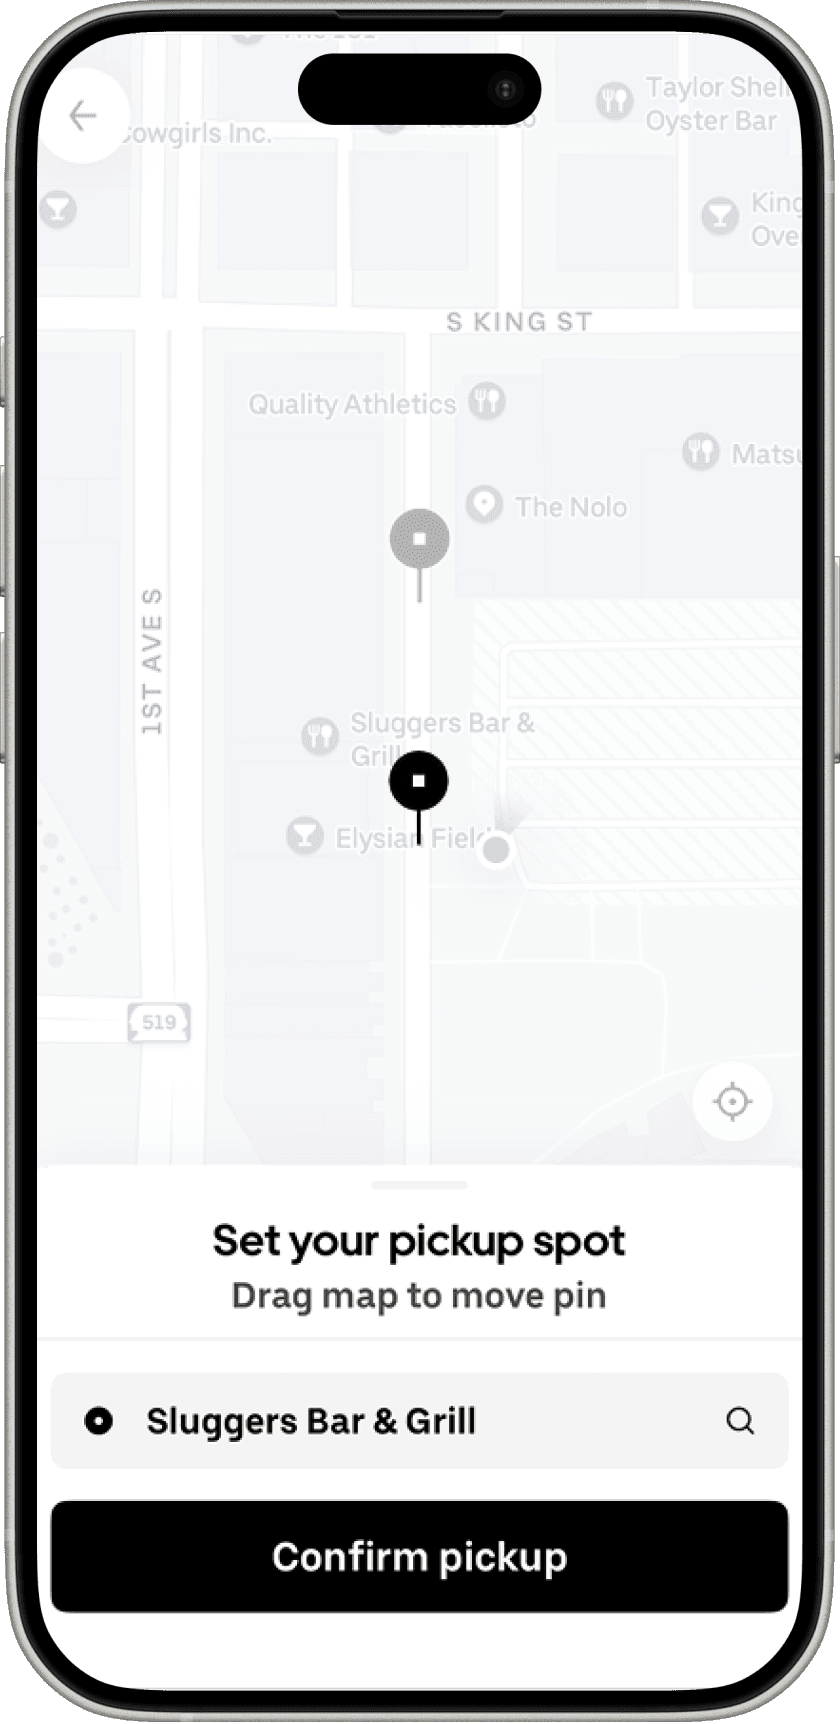
Riders are doing the app's job by finding their own ways to overcome limitations.
The app doesn't provide enough guidance, so riders have to create their own strategy by comparing price, walking time, and wait time.

"I walked two blocks away to avoid the crowd, but I'm not sure if this is the fastest way." — P5
"We spent 30 minutes waiting, then kept moving and retrying ride requests." — P3
Current experience
Interaction Direction
System recommendation vs Guided choice
Based on this insight, I explored two ways to help riders choose a pickup spot while balancing decision support and user control:
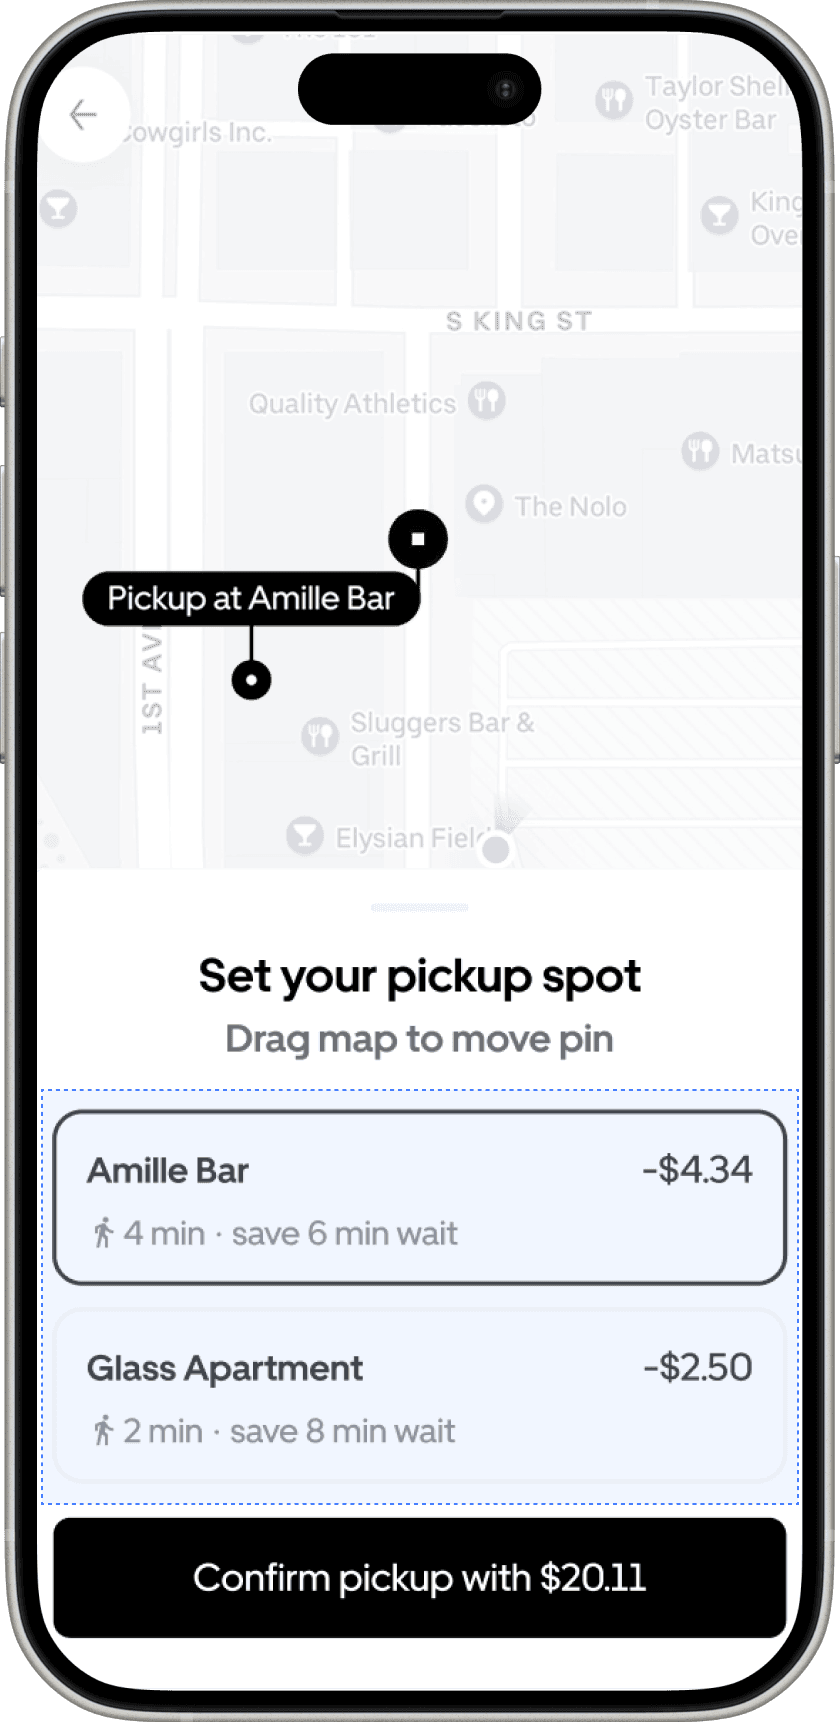
Option A: System recommendation


Option B: Guided choice

Why I chose guided choice
After testing both options, I chose guided choice because users liked having recommended pickup options, but still wanted the freedom to choose for themselves.

Iteration
2 pickup options worked better than 1 and many
Once the interaction model was set, I tested whether riders preferred seeing 1, 2, or multiple pickup options. Most participants preferred 2 options because it gave them enough information to compare trade-offs without feeling overwhelmed.

Reducing mental math in price comparison
Next, I refined how pricing was presented. When we first showed price savings, users paused to calculate the final price. They preferred seeing the total price because it made comparing options easier.

map visualization
Visualizing congestion on the map
To support guided pickup decisions, I explored different ways to visualize congestion on the map. While stakeholders initially preferred colored lines for their precision, testing showed heatmaps were much easier to scan at a glance, so we prioritized speed of understanding over exact boundaries.

Design strategy
Progressively reveal information across 3 zoom levels
To address the heatmap's limited precision and reduce information overload, I progressively revealed information across three zoom levels. This also allowed us to introduce walking time and nearby Lime options when available.

final design
Supporting informed pickup decisions before requesting a ride
The final experience combines guided pickup recommendations, progressive information disclosure, and clearer pricing to support confident pickup decisions before requesting a ride.
Impact
Testing showed higher rider confidence and faster pickup decisions under crowded conditions
Uber sponsors responded positively to the concepts, research findings, and design rationale presented in our final review.
Predicted business impact
📈 Higher pickup confidence -> Fewer avoidable cancellations
📉 Faster pickup decisions -> Less coordination friction
📈 Greater rider trust -> Stronger long-term retention
Validated outcomes
I conducted post-test usability sessions with 10 participants. Compared with the original experience, participants reported higher ratings for:
39%
Increase in confidence in meeting their driver
Confidence rating: 3.00 → 4.17 / 5.0
43%
Reduction in pickup spot selection time
Selection time: 12.0 sec → 6.8 sec
Reflection
Beyond the metrics, this project shaped how I think about product design:
Design for context, not completeness.
I realized that more information doesn't always help people make better decisions. What matters is giving people the right information when they actually need it. Designing around context, rather than showing everything at once, helped riders feel more confident without adding cognitive load.
Behavior is evidence for product decisions.
Watching riders interact with the prototype revealed behaviors interviews alone couldn't uncover. Instead of designing based on assumptions, we used those behaviors to validate decisions like how many options to show, how prices should be presented, and what information mattered most at each step.


Learn More
There's so much more behind the scene! Reach out to see additional design explorations.

02
Process Book
See the entired process of research, synthesis, iterations, and design rationale.